Report Viewer: Difference between revisions
| Line 41: | Line 41: | ||
A detailed outline of each operator is on the [[Operators]] page. | A detailed outline of each operator is on the [[Operators]] page. | ||
===== Conditions Example - | ===== Conditions Example - Policy by Policy ID ===== | ||
In many cases, you may just want to see the traffic related to a specific policy within | In many cases, you may just want to see the traffic related to a specific policy within Policy Manager. This can be accomplished very easily by adding a condition using the Quick Add feature. | ||
# In the Conditions panel, select '''Add'''. | # In the Conditions panel, select '''Add'''. | ||
# Choose '''Policy ID''' and specify equals and the policy ID in question. | # Choose '''Policy ID''' and specify equals and the policy ID in question. | ||
# The conditions is applied and will remain applied as you switch between reports. | # The conditions is applied and will remain applied as you switch between reports. | ||
===== Conditions Example - Web Filter Categories ===== | ===== Conditions Example - Web Filter Categories ===== | ||
Revision as of 16:38, 19 September 2022
Reports
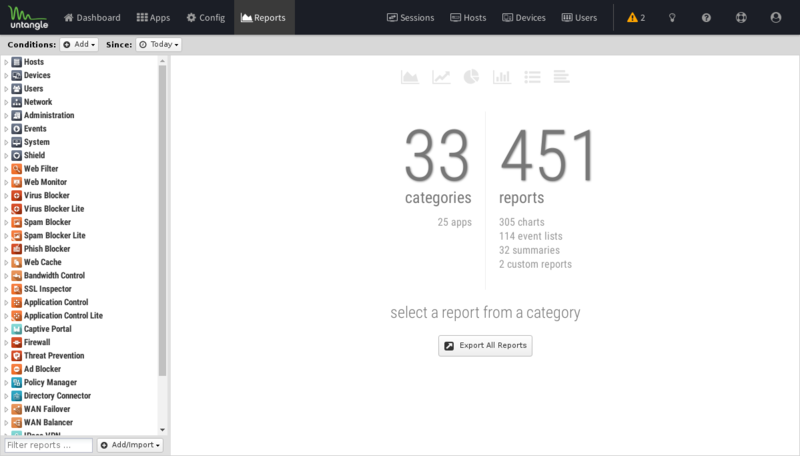
Reports provide a graphical view of the network traffic and actions of your NG Firewall. Various reports are available within applications and base system components. The reports can be manipulated to drill down, customize, and export data in many ways using the Report Viewer.

Report Viewer
There are a few panels in the Report Viewer:
- The top panel: This top panel (just below the navigation menu) allow you specify which data is viewed. By default, there is just a timeframe and no conditions, so reports will show all data for the specified timeframe. Conditions can be viewed to view more specific data, such as a specific host, user, domain, application, web category, etc.
- The left panel: This allows you to choose the report you wish to view. At the bottom you can use the search box to quickly find reports with the specified string in the title. You can also import and create new reports using the "Add/Import" button.
- The chart panel: This panel shows you the specified report. It also includes several action buttons at the top.
- The data panel: The data panel, hidden by default, can be displayed by clicking on the "Data View" button in the chart panel. This will show the raw data used to generate the chart and allow the user to export the data by clicking the "Export Data" button at the bottom.
Conditions
The Conditions panel appears at the top panel and can be used to filter data displayed in reports. For example, to view a "specific" host's report, you can add a condition for Client = "192.168.1.100" and then all reports available will only show data where the client is 192.168.1.100. Multiple conditions can be added to drill down and inspect data. Conditions can also be added quickly by clicking on slices in pie charts.
The Add Condition dropdown contains many commonly used conditions, or the full list of all tables and columns can be browsed by clicking on the "More" button to add conditions for any database column.
Note: Conditions will not apply to all reports. For example, If viewing a specific users report by adding a condition where Username = foobar - many reports will be greyed out and unviewable. This is because the data used to generate those reports is not relevent to the specific user (it does not contain a username column). For example, the CPU usage report is a system report that is not relevant to a specific network user and so there is no way to filter that data by user.
Condition Operators
The second field in the condition is the logical operator that will be used in evaluating the condition value defined in the last field. In most use cases the default "=" operator is what you want to use. However, there are several other operators available that make the reports and alerts a whole lot more powerful.
A detailed outline of each operator is on the Operators page.
Conditions Example - Policy by Policy ID
In many cases, you may just want to see the traffic related to a specific policy within Policy Manager. This can be accomplished very easily by adding a condition using the Quick Add feature.
- In the Conditions panel, select Add.
- Choose Policy ID and specify equals and the policy ID in question.
- The conditions is applied and will remain applied as you switch between reports.
Conditions Example - Web Filter Categories
From pie charts, you can quickly add a condition from the Current Data window. This can be handy for use with the Web Filter category selection which we'll use for this example. Once the condition is applied, we can then use other reports to drill down to find out more information about the traffic such as which user might be responsible.
- Open Report Viewer or the Web Filter Reports tab.
- Select the Top Categories report (by size or requests). In our example, you can see Games was at the top.
- Click on the Games pie slice, and when prompted to add a condition click Yes.
- All Reports can now be viewed for Games only traffic.
- For example, the Top Clients (by request) will show the clients that visited the most gaming sites.
- For exmaple, the Web Usage (scanned) will show "Gaming" web usage throughout the day of the network.
