Custom Reports
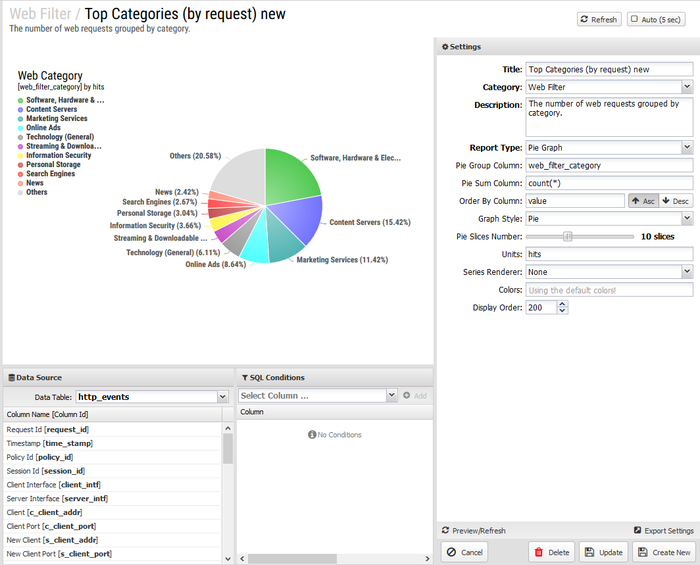
Custom Reports allow you to create a report to your specifications and save the report for future use. These can be added by copying an existing report and modifying it to your needs, or by creating a report from scratch. Both methods require a strong understanding of how reports in Untangle work and the Database Schema.
If you're having trouble creating any reports give us a shout on the forums or through support. As we receive requests for common reports we will add these as default reports in future releases.
Add Custom Reports
The Copy or Customize features allow you to use an existing report as a base for creating new reports. We recommend using an existing report to base your custom report as the fields and queries are much easier to understand.
Copy Report
- In the Reports App, go to the Manage Reports tab.
- Locate the report you want to copy and click Edit.
- Click the Copy Report button. A copy of the report is made with the title "Copy of" the report you selected.
- Rename the report and modify other report settings as needed.
- Click View Report at any time to preview the report.
- Click Done to save the report.
Customize Report
- When viewing a report within an application, click the Customize button.
- Rename the report and modify other report settings as needed.
- Click Save as New Report to save the report.
Add Report
- In the Reports App, go to the Manage Reports tab.
- Click the Add button. A blank report form will appear.
- Name the report, select the type of graph and fill other fields to customize the report.
- Click View Report at any time to preview the report.
- Click Done to save the report.
Report Fields

The following fields will be there when modifying or creating a new custom report.
| Report Field | Description |
|---|---|
| Category | The app where the report will be displayed. |
| Title | Title of the report. |
| Description | Description will be shown under the title of the report to provide the reader more information. |
| Enabled | Disabled reports will not be shown in the list within the application. |
| Display Order | Determines the order the reports are displayed within the application. |
| Units | Unit of measure displayed on the graph. |
| Table | Table from the Database Schema to query. |
| Type | Time Chart (Line or Bar), Pie Chart, or Text Chart. |
| Time Chart Style | Line, Bar, or Bar 3D. Bar charts can also be overlapped or separate columns. |
| Time Data Interval | Auto is recommended. You can also use seconds, minutes, hours, day, week or month. |
| Time Data Columns | Data from the table defined above that you wish to use for your chart. This is written with SQL syntax. Add each column or data series on a new line. See the Web Usage (all) report for a good example. |
| Pie Group Column | Column from the table defined above that you wish to group data by. This uses the column name from the Database Schema. |
| Pie Sum Column | Determines how data is calculated after grouping. Common functions would be count() and sum() for specific columns within the table. See the Web Filter Top Sites reports (by size and by request) for good examples. |
| Pie Slices Number | Determines how many results are shown. |
| Text Columns | Data from the table defined above that you wish to use for your page. This is written with SQL syntax. Add each column or data series on a new line. These will be referred to in the text string using the line number. |
| Text String | Text string to be shown on the page. This can include columns from the text columns query. See the Ad Blocker summary report for a good example. |
| Color | Colors used in the chart, defined by hex color codes. |
| Order By Column | Determines how the order will be determined. This will typically be 'value' for pie charts, and left blank for others. |
| Order Direction | Order for the data to be displayed. For a pie chart, this is typically Descending and for time chart, this is typically Ascending. |
| Sql Conditions | Additional conditions added to the data. This can be useful for specifying a username, IP address of other information. |
Custom Report Example - User Reporting
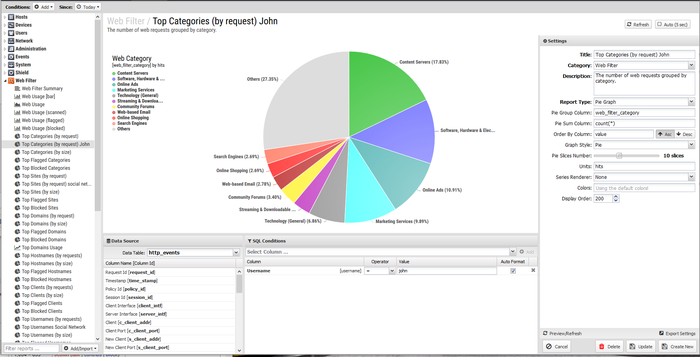
A commonly requested report is to be able to monitor a problem employee or student who is using bandwidth excessively or accessing inappropriate web content. You can add this report so that it is always accessible under the Web Filter report tab very easily.
To start, get an idea of the reports you're interested in. For this example we'll use Top Sites (by size), but others like Top Categories or Top Flagged sites might also be useful. This is intended to be a rough outline of the procedure; adjust as needed.
Creating the Report
- In the Reports app, go to the Manage Reports tab.
- Scroll to the Web Filter and select a report. Click Edit.
- Click Copy Report
- Update the Title for the report and description if necessary.
- Since you are interested in the same type of data, all other report fields can remain the same.
- In Sql Conditions, add conditions. For this example we will use the username but you might also use hostname, client address of other fields.
- Click Add.
- In the Column field, select username.
- Use the = operator and enter the username for the user in the Value field.
- Click Done.

After adding the report, it will be easily accessible in the Web Filter Reports tab and under Manage Reports.
Custom Report Example - Rack Reporting
With Policy Manager, racks can be created to allow different policies to apply to different groups. When reporting, you might wish to see how traffic is being handled differently across racks. Creating custom reports to show information related to a specific rack is easy to accomplish.
For this example we'll use Application Control Top Flagged Applications, but this same procedure would apply for any other application or report. This is intended to be a rough outline of the procedure; adjust as needed.
Find the Rack ID
- Open Policy Manager Settings.
- Under the Policies tab is a listing of racks with the ID.
- Take note of the rack(s) of interest. For this example we'll use rack id 6 for Mobile Devices.

Creating the Report
- In the Reports app, go to the Manage Reports tab.
- Scroll to the Application Control reports and select a report. Click Edit.
- Click Copy Report
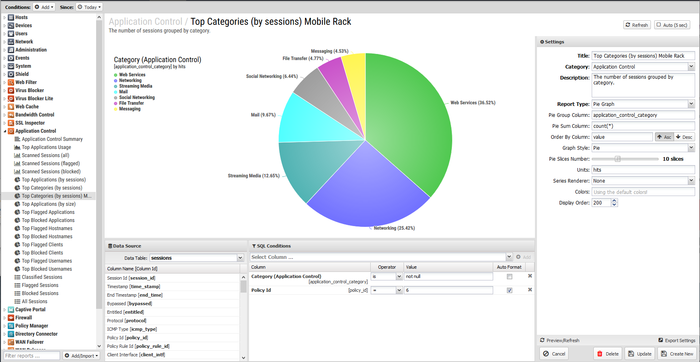
- Update the Title for the report and description. Here we have added "Mobile Devices Rack".
- Since you are interested in the same type of data, all other report fields can remain the same.
- In Sql Conditions, add the condition for the policy_ID.
- Click Add.
- In the Column field, select policy_id.
- Use the = operator and enter the policy id of 6 (matching the Mobile Devices rack) in the Value field.
- Click Done.

After adding the report, it will be easily accessible in the Application Control Reports tab and under Manage Reports.