NG Firewall Performance Guide: Difference between revisions
No edit summary |
|||
| Line 339: | Line 339: | ||
Users often request performance metrics be published by vendors. Untangle doesn’t do this. Here's why: | Users often request performance metrics be published by vendors. Untangle doesn’t do this. Here's why: | ||
Traditionally, network devices quantify network performance in throughput. Untangle doesn’t publish throughput numbers because it is obviously hardware-dependent, but, more importantly, because it’s just irrelevant. | Traditionally, network devices quantify network performance in throughput. Untangle doesn’t publish throughput numbers because it is obviously hardware-dependent, but, more importantly, because it’s just irrelevant. Modern bare minimum hardware doesn’t have a tough time supporting 1Gbit, which is usually more than most users running minimal hardware have at the gateway. It doesn’t require a lot of hardware to support gigabit or 10 gigabit or more levels of throughput. | ||
What matters a great deal is the type of traffic. For example, 100Mbit of continuous tiny HTTP fetches and tiny HTTP downloads requires significantly more work to process than one big HTTP download taking 100Mbit which takes almost no resources. However, at the packet level, both are just 100Mbit/sec of packets. | What matters a great deal is the type of traffic. For example, 100Mbit of continuous tiny HTTP fetches and tiny HTTP downloads requires significantly more work to process than one big HTTP download taking 100Mbit which takes almost no resources. However, at the packet level, both are just 100Mbit/sec of packets. | ||
Revision as of 17:27, 16 October 2018
Untangle Performance Tuning
This guide describes what factors determine the performance of your Untangle server and configuration and how you can tune your Untangle for optimal performance.
Usually on modern hardware "tuning" really isn't necessary for the huge majority of sites. However, if you are running on a tiny server or running a large site with thousands of users doing more than 100Mbit 24/7, then this guide may help you tune your Untangle to get the best performance out of it.
Performance Factors
There are several main components that determine the performance of your Untangle setup.
- Server Hardware
- Configuration
- Traffic Profile
Of course, all three of these are closely interrelated. Lets analyze each one such that you can find a working configuration.
Hardware
If you are choosing what hardware to run or evaluating hardware, this section can help make sure you have the optimal setup. If you already have hardware it still may be useful to understand in case you need to add more memory or just monitor resource consumption.
While server performance is extremely complex and there are many different kinds of resources. The most important resources that can be limiting factors are memory, CPU, disk I/O (input/output).
When people think of server performance they usually think of CPU speed. While CPU clock speed and processing power are important, they are the least important resource of these three for Untangle’s work load. More cores and faster cores help, but you can actually run a large site on a fairy underpowered CPU if you have plenty of memory and disk I/O.
Memory is extremely important up to a point. You need enough memory to store Untangle’s working set with some left over to serve as disk cache. If you have a major shortage of memory, you’ll see consistent swapping, performance will be sluggish, and large pauses will occur. Once you have enough memory, you may want to add more for better disk cache, but you won’t see massive gains from doubling memory if you already have enough.
For large sites an important resource for Untangle is disk speed or disk I/O throughput. Unfortunately, when evaluating servers it is often overlooked and the hardest to quantify. Unlike a typical firewall which has flat log files, Reports runs a database and each application logs information to the database through the reporting system. For large sites this can be many millions of events every hour. Systems experiencing disk I/O saturation can experience long pauses and major sluggishness.
Generally, I would just plan on having plenty of all 3 types of resources for your setup with some overhead available, just in case. It is absolutely essential to have at least enough of memory and disk I/O. You can have a 16 core machine with 16 gigs RAM, but if your disk is slow, that will ultimately be your limiting factor.
Also, NICs or Network cards also matter. Its hard to quantify which are good network cards. Generally speaking intel NICs are the best supported as they are common and the drivers are current and very good.
Virtualization can be a source of additional performance woes. The same principles apply. If Untangle is given sufficient (virtual) resources it will run great. However, if other VMs running on the same virtualization platform manage to saturate the disk I/O, Untangle performance will suffer.
Configuration
Configuration obviously has a huge effect on the performance of your setup. Which apps are installed and their configuration has a huge impact on the amount of work the Untangle system has to do to process the network traffic.
Many new users expect Untangle performance to be comparable to other software firewall solutions available with similar hardware requirements. This is usually true if you install just the Firewall application and maybe some lighter apps. Untangle will have slightly higher latency than your typical layer-3 firewall at these tasks because Untangle (by default) processes all sessions at layer 7, which means it reconstructs the stream for processing before deconstructing it again on the other side.
Where Untangle starts to diverge from traditional router software is when you start installing the apps which can have huge impact on the resource requirements. For example, Virus Blocker Lite requires a large amount of memory all by itself because it uses clamav which uses a lot of memory. Web Filter requires much less, since it does its categorization through a cloud service with a local cache. Reports, on the other hand, requires almost no additional memory, but requires a large amount of disk I/O to process and store events. The following chart provides a high-level guide to which resources and how much of each resource each app requires.
| Component/App | Memory | CPU | Disk I/O |
|---|---|---|---|
| Platform | medium | medium | medium |
| Web Filter | low | low | low |
| Web Monitor | low | low | low |
| Virus Blocker | medium | medium | medium |
| Virus Blocker Lite | very high | medium | medium |
| Spam Blocker | high | medium | medium |
| Spam Blocker Lite | medium | medium | medium |
| Phish Blocker | very high | medium | medium |
| Web Cache | medium | low | high |
| Bandwdith Control | low | medium | low |
| SSL Inspector | low | medium | low |
| Application Control | low | medium | low |
| Application Control Lite | low | low | low |
| Firewall | low | low | low |
| Ad Blocker | low | medium | low |
| Reports | medium | medium | high |
| Policy Manager | low | low | low |
| Directory Connector | low | low | low |
| WAN Failover | low | low | low |
| WAN Balancer | low | low | low |
| Captive Portal | low | low | low |
| IPsec VPN | low | low | low |
| OpenVPN | low | low | low |
| Intrusion Prevention | very high | medium | low |
| Configuration Backup | low | low | low |
| Branding Manager | low | low | low |
| Live Support | low | low | low |
Note: these are just an estimates. The configuration of the app itself can matter a great deal. Virus Blocker can require very little, but if configured to scan every .png downloaded over HTTP, it will be significantly more costly. Intrusion Prevention memory usage is directly related to its configuration. If configured with a huge ruleset it will use an huge amount of memory.
As mentioned earlier, none of the apps require an intense amount of CPU power; therefore, it is less important. Disk I/O and memory are very important. If you are short on Disk I/O, try disabling Reports, which will lessen the disk I/O requirements a significant amount. Likewise, if you are short on memory, try removing Intrusion Prevention or Spam Blocker and possibly Virus Blocker Lite and Phish Blocker.
The other important aspect of configuration is bypass rules. By default, Untangle processes all ports of TCP and UDP at layer 7. For many sites, this is overkill, and significant gains can be had by just adjusting the bypass rules to bypass traffic that doesn’t require scanning.
Network
The type and amount of traffic on your network plays in important part in your Untangle performance. Unfortunately, it isn’t always a variable you can tune as the traffic on your network is the traffic on your network.
However, at some sites it is appropriate to restrict certain behavior that is not considered an appropriate use of network resources. Often schools may block or shape bittorrent, or use quotas to enforce reasonable bandwidth usage, or outright block content from inappropriate sites. Other tips below suggest ways to tune your configuration to optimized for your network traffic profile.
Summary
Hopefully this article helps illuminate some of Untangle’s inner workings and its performance characteristics. Users often ask “How big of a server do I need on a site with X thousand users?” or “Is this server big enough for this site?” Unfortunately these questions are impossible to answer as the difference from one site to the next site and one configuration to the next configuration can be drastic.
As general guidance, buying a server with good hardware, several cores, and a few gigs of memory, and a good disk setup can handle huge sites if configured correctly. If you aren’t sure how to configure it correctly, call Untangle support. If you aren’t sure what server to get, remember disk I/O is what matters. If you just want one that will just work, check out our appliances as we have tested those extensively.
Checking your Performance
How can you tell if the Untangle server is running optimally?
The most important thing is to check how the network is running. Is the network fast? Are web pages loading quickly? There should be absolutely zero noticeable delay in internet traffic. There should be no noticeable latency nor throughput degradation.
Note: If you run a download test and are getting less throughput then you expect this is rarely related to server CPU/RAM/Disk. Usually this is related to configuration like QoS settings, NIC issues, Duplex issues, MTU issues, or something else.
In addition to checking real-world network traffic performance you likely want to look and see how stressed the Untangle server is in Reports > Server while handling the network traffic.
If you look at the CPU Load graph and see any large spikes where the load is higher than the number of CPU cores of the server, this is suspect. If its a very large number (30+) then you probably have an issue. When these spikes occur traffic will be very sluggish and its likely due to a disk I/O shortage or a memory shortage (or a memory shortage that causes swapping which causes a disk I/O shortage).
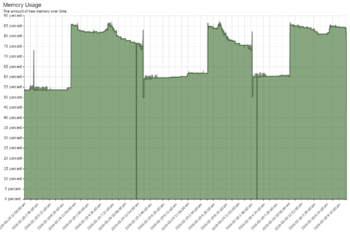
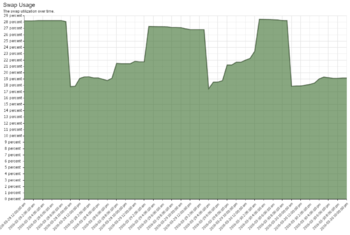
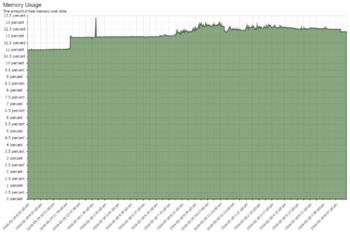
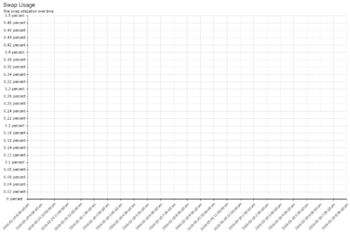
If you look at Memory Usage and you see it hitting 85% plus frequently, you may want to consider more RAM. However, its not necessarily an issue if Swap is not being used excessively. If you look at the Swap Usage and see it using a significant portion of swap and wild swings, it is probably an indication that your working memory set is larger than the amount of memory in the server. This is bad.
This server has less memory than it probably should. It works but is not performing optimally for its configuration.
The below server has way more memory than is necessary for its configuration and network load.
The key when looking at server performance is to see if it is within the 'normal' operating zone all the time. If there are spikes or times when its running very low or memory or doing large amounts of swapping performance may suffer during these times.
Below are some techniques available to tune the performance of your server.
Tuning Tips
Here are some common tests and changes you can do to analyze and optimize your performance.
Disable logging of bypassed traffic
Do you care about logging/reporting of traffic that is bypassed (not scanned by the apps)?
This includes:
- Traffic that is explicitly bypassed with bypass rules. (that would have otherwise been scanned)
- Traffic from the Untangle server itself (DNS lookups, cloud lookups, signature updates, etc)
- Traffic to the Untangle server itself (DNS lookups, Administration, etc)
Most users do not need this information. The best performance can be had by unchecking in Config > Network > Advanced > Options: Log bypassed sessions Log outbound local sessions Log inbound local sessions' Log blocked sessions
With this configuration only scanned traffic is logged, which is going to be fine in most cases except where you need to be able to audit all network traffic that has occurred or all traffic needs to be logged for bandwidth accounting.
Bypass unimportant traffic
Look in Reports > Network > Top Ports by Session and Reports > Network > Top Ports by Bytes. Do you see any uncommon ports that comprise a significant amount of your traffic? If so consider bypassing it.
For example, sometimes we’ll look at a site and see millions of sessions to port 514. Its doubtful that a site like this really needs to spend the server resources on scanning their internal syslog traffic (port 514). This traffic can safely be bypassed.
A more normal traffic profile will show the more common ports (80 for HTTP, 443 for HTTPS, 53 for DNS, etc being the most common ports).
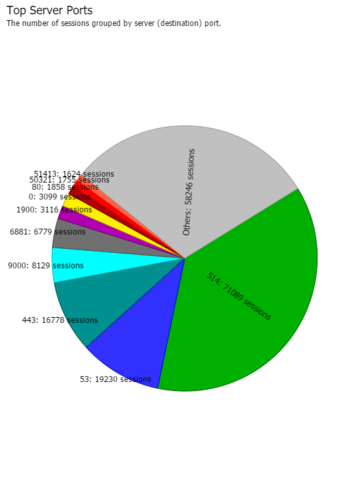 |
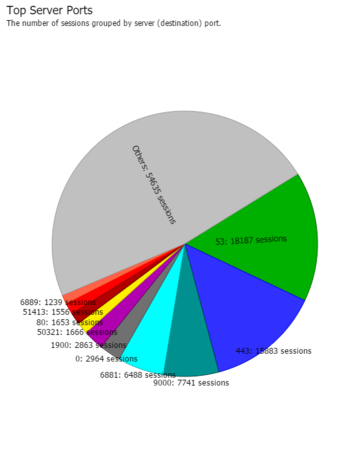 |
| A suspect traffic profile | A normal traffic profile |
If you see something non-standard as the top port, you may want to investigate what it is and consider bypassing it.
Bypass DNS
If Untangle itself is the DNS server, then DNS is automatically bypassed. However, if DNS is going *through* Untangle it is scanned/categorized/scrubbed just like normal traffic.
In some cases this is desirable if you want to use Captive Portal, or Firewall and/or policies to control internet access. However in some cases users may not care about DNS or it can be managed solely with filter rules (at layer 3) even when bypassed which is much faster. In these cases you can bypass all UDP port 53 and save a lot of server processing power.
Bypass UDP
Similarly to bypassing DNS, depending on the use case many sites can actually bypass all UDP. If you are trying to control applications, shape bandwidth, or run captive portal, this won't work because a significant amount of internet traffic is UDP based. However, if the goal is simply to filter web traffic, then scanning UDP is not necessary and bypassing it can save a lot of server processing power.
Shape bandwidth
Do you have bandwidth hogs or certain applications that are hogging network resources? A quick look at Reports > Bandwidth Control > Top Clients (by total bytes) will show if you have any clients on the network that are significantly different than other clients. Reports > Bandwidth Control > Top Application (by total bytes) will show if you have any applications on the network that are using more resources than they should.
In some cases, you can actually change the network profile. For example, schools often struggle with P2P and bittorrent saturating the bandwidth and causing performance bottlenecks at the WAN. Application Control and Bandwidth Control can provide essential tools for blocking or slowing unimportant traffic to limit both the bandwidth requirements and server resource requirements.
Quotas in Bandwidth Control can provide a useful low-maintenance tool to automatically slow clients when they are using more data then you think in reasonable.
Remove unnecessary apps
Performance tuning may require being pragmatic about which applications you install and run. Untangle makes it VERY easy to install and enable apps, but that doesn't mean its always a good idea.
Web Cache requires lots of server resources and likely provides very little value. Often this results on a net-negative ROI. It is suggested not to run it except in very special circumstances.
Intrusion Prevention requires a lot of memory and CPU resources but provides little measurable security benefit. If you are low on memory, then its certainly better to leave this disabled. The more rules you have enabled the more memory is required.
Tune SSL Inspector
SSL Inspector, if enabled, can consumer a lot of CPU processing power to handle all of the certificate generation, decryption and re-encryption.
If running SSL Inspector it is worth looking very carefully at the "Top Inspected Sites" verify that CPU is being invested into traffic that you actually want inspected. If running inspection on most or all of HTTPS traffic, a good deal of extra processing power is useful.
Look for misbehaving hosts
Misbehaving hosts can often suck network and server resources by flooding the network, sending spam, scanning the internet for vulnerable hosts, and other crazy activities. Its not always an infected hosts - in some cases applications that are explicitly blocked often retry the connection with no delay and this can lead to accidental floods of connections.
Check the reports to look for suspicious activity. Reports > Shield > Top Blocked Clients might reveal if there are any hosts that may be behaving suspiciously. Its normal to see some blocked clients, however if you see millions of sessions being blocked that host may be doing something suspect and it warrants investigation.
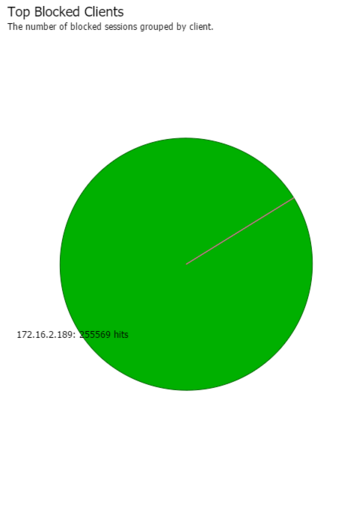
Finding and investigating these hosts and their activity can help you keep your network and configuration of Untangle in the optimal state.
Check your settings
Some settings are very expensive.
- Did you enable syslog reporting in Reports? Syslog reporting of every single event is expensive. If you are not doing anything with that information, disable it.
- Is Virus Blocker or Virus Blocker Lite scanning a huge number of files? Sometimes web apps download thousands files as part of regular usage. (Office can download hundreds of .cab files from office.net). You can disable scanning of that file type or add a common site to the pass list to skip scanning those files.
Performance Numbers
Users often request performance metrics be published by vendors. Untangle doesn’t do this. Here's why:
Traditionally, network devices quantify network performance in throughput. Untangle doesn’t publish throughput numbers because it is obviously hardware-dependent, but, more importantly, because it’s just irrelevant. Modern bare minimum hardware doesn’t have a tough time supporting 1Gbit, which is usually more than most users running minimal hardware have at the gateway. It doesn’t require a lot of hardware to support gigabit or 10 gigabit or more levels of throughput.
What matters a great deal is the type of traffic. For example, 100Mbit of continuous tiny HTTP fetches and tiny HTTP downloads requires significantly more work to process than one big HTTP download taking 100Mbit which takes almost no resources. However, at the packet level, both are just 100Mbit/sec of packets.
Another common metric is maximum number of sessions. Untangle does not publish these numbers because they are similarly misleading. Vendors publish these numbers for their servers when they are “optimally” configured, which is a code word for configured for maximal performance and minimum utility. Publishing the performance of Untangle with traffic bypassed and no apps installed is not useful because no one runs it like that since it provides no utility in that configuration.
We did some internal testing of common appliances currently available. None of them even supported 10% of the advertised maximum number of sessions with a “reasonable” configuration.
After reading, this if you’re still worried about the typical performance metrics, then rest assured that its fairly easy to configure your Untangle server to support 256k concurrent sessions and more than gigabit throughput even on small servers.
