Reports: Difference between revisions
No edit summary |
No edit summary |
||
| (22 intermediate revisions by 3 users not shown) | |||
| Line 2: | Line 2: | ||
<span style="display:none" class="helpSource reports">Reports</span> | <span style="display:none" class="helpSource reports">Reports</span> | ||
<span style="display:none" class="helpSource reports_status">Reports#Status</span> | <span style="display:none" class="helpSource reports_status">Reports#Status</span> | ||
<span style="display:none" class="helpSource | <span style="display:none" class="helpSource reports_data">Reports#Data</span> | ||
<span style="display:none" class="helpSource reports_email_templates">Reports# | <span style="display:none" class="helpSource reports_email_templates">Reports#Email_Templates</span> | ||
<span style="display:none" class="helpSource | <span style="display:none" class="helpSource reports_reports_users">Reports#Reports_Users</span> | ||
<span style="display:none" class="helpSource reports_name_map">Reports#Name_Map</span> | <span style="display:none" class="helpSource reports_name_map">Reports#Name_Map</span> | ||
<span style="display:none" class="helpSource reports_all_reports">Reports#All_Reports</span> | <span style="display:none" class="helpSource reports_all_reports">Reports#All_Reports</span> | ||
<span style="display:none" class="helpSource reports_reports">Reports#Reports</span> | <span style="display:none" class="helpSource reports_reports">Reports#Reports</span> | ||
| Line 13: | Line 11: | ||
{| width='100%' | {| width='100%' | ||
|- | |- | ||
| align="center" | [[Image: | | align="center" | [[Image:Reports.png|128px]] '''Reports''' | ||
| align="center" | | | align="center" | | ||
{| | {| | ||
| Line 21: | Line 19: | ||
|[http://www.untangle.com/store/reports.html Reports Description Page] | |[http://www.untangle.com/store/reports.html Reports Description Page] | ||
|- | |- | ||
|[http:// | |[http://demo.untangle.com/admin/index.do#service/reports Reports Demo] | ||
|- | |- | ||
|[http://forums.untangle.com/reports/ Reports Forums] | |[http://forums.untangle.com/reports/ Reports Forums] | ||
| Line 34: | Line 30: | ||
== About | == About NG Firewall Reports == | ||
Reports provides users with detailed statistics of the traffic and activity on your network. | Reports provides users with detailed statistics of the traffic and activity on your network. | ||
| Line 40: | Line 36: | ||
These reports can be viewed online, either through the administration interface or through the separate reporting interface available to non-administrators reporting-only users. | These reports can be viewed online, either through the administration interface or through the separate reporting interface available to non-administrators reporting-only users. | ||
Customizable report summaries can be sent via email, which includes basic information and a link to view the online reports if the user has access. | |||
Reports can backup your data in multiple formats to Google Drive for long term storage. | Reports can backup your data in multiple formats to Google Drive for long term storage. | ||
| Line 57: | Line 49: | ||
On this tab you can click '''View Reports''' to open up Reports in a new browser tab. | On this tab you can click '''View Reports''' to open up Reports in a new browser tab. | ||
{{ServiceAppScreenshot|reports|status}} | |||
=== All Reports === | === All Reports === | ||
This is the full list of all currently existing reports. This includes all the default reports and any custom reports that have been added. | |||
To edit a report, click on ''View'' and then click on ''Settings.'' | |||
To delete a custom report, click on ''View'' and then click on ''Delete.'' | |||
To create a new custom report, click ''View'' on an existing similar report, then click ''Settings'' then change the name and click ''Save as New Report.'' | |||
To create a report from scratch, go to ''Reports'' and click on ''Create New'' in the lower left. | |||
When creating reports from scratch, each field must be carefully chosen and tuned until the desired data is provided. This process can be time consuming and difficult. It is suggested to work with a similar report to required the desired result. Additionally you can ask for help via support or the forums and import the report if someone can craft it for you. | |||
If creating a report from scratch, the settings and fields and their purposes are described below. | |||
{{ServiceAppScreenshot|reports|all-reports}} | |||
==== Report Entry ==== | |||
A report is many settings that essentially describe how to craft a SQL query and how to display the data. | |||
Here are the fields: | |||
{| border="1" cellpadding="2" | |||
|+ | |||
! Name !! Value !! Available !! Description | |||
|- | |||
| style="width: 20%;"|Report Type | |||
| Text, Pie Graph, Time Graph, Time Graph Dynamic, Event List | |||
| The type of graph | |||
|- | |||
| Title | |||
| Text | |||
| All | |||
| The report title | |||
|- | |||
| Category | |||
| Any existing category/application | |||
| All | |||
| The category in which the report is located | |||
|- | |||
| Description | |||
| Text | |||
| All | |||
| A brief description of the report | |||
|- | |||
| Text String | |||
| Text | |||
| Text | |||
| The text used to create the Text Report Type | |||
|- | |||
| Pie Group Column | |||
| Text | |||
| Pie Graph | |||
| The column to "group by" in top X charts (usually user, host, and so on) | |||
|- | |||
| Pie Sum Column | |||
| Text | |||
| Pie Graph | |||
| The column to sum in the top X charts (usually count, bytes, and so on) | |||
|- | |||
| Order By Column | |||
| Text | |||
| Pie Graph | |||
| The column to order by | |||
|- | |||
| Graph Style | |||
| Pie, Pie 3D, Donut, Donut 3D, Column, Column 3D | |||
| Pie Graph | |||
| The render style of the pie graph | |||
|- | |||
| Pie Slices Number | |||
| Integer | |||
| Pie Graph | |||
| The number of slices to display | |||
|- | |||
| Units | |||
| Text | |||
| Pie Graph | |||
| The units being displayed (usually bytes, sessions, and so on) | |||
|- | |||
| Graph Style | |||
| Line, Area, Stacked Area, Column, Overlapped Column, Stacked Columns | |||
| Time Graph | |||
| The render style of the time graph | |||
|- | |||
| Time Data Interval | |||
| Auto, Second, Minute, Hour, Day, Week, Month | |||
| Time Graph | |||
| The time aggregation unit or resolution | |||
|- | |||
| Approximation | |||
| Average, High, Low, Sum | |||
| Time Graph | |||
| The method used to aggregate/combine data points | |||
|- | |||
| Units | |||
| Text | |||
| Time Graph | |||
| The units being displayed (usually bytes, sessions, and so on) | |||
|- | |||
| Series Renderer | |||
| None, Interface, Protocol | |||
| Time Graph | |||
| The renderer used to display human-readable names | |||
|- | |||
| Dynamic Column | |||
| Text | |||
| Time Graph Dynamic | |||
| The column to select for/group by | |||
|- | |||
| Dynamic Value | |||
| Text | |||
| Time Graph Dynamic | |||
| The value to sort by and display | |||
|- | |||
| Dynamic Limit | |||
| Integer | |||
| Time Graph Dynamic | |||
| The number of series to show | |||
|- | |||
| Aggregation Function | |||
| Count, Sum, Min, Max | |||
| Time Graph Dynamic | |||
| The function used to aggregate by dynamic values grouped by dynamic column | |||
|- | |||
| Graph Style | |||
| Line, Area, Stacked Area, Column, Overlapped Column, Stacked Columns | |||
| Time Graph Dynamic | |||
| The render style of the time graph | |||
|- | |||
| Approximation | |||
| Average, High, Low, Sum | |||
| Time Graph Dynamic | |||
| The method used to aggregate/combine data points | |||
|- | |||
| Units | |||
| Text | |||
| Time Graph Dynamic | |||
| The units being displayed (usually bytes, sessions, and so on) | |||
|- | |||
| Series Renderer | |||
| None, Interface, Protocol | |||
| Time Graph Dynamic | |||
| The renderer used to display human-readable names | |||
|- | |||
| Colors | |||
| Color Picker | |||
| All | |||
| The color palette to use | |||
|- | |||
| Display Order | |||
| Integer | |||
| All | |||
| The integer used to determine the report's position in the category list | |||
|} | |||
=== Data === | === Data === | ||
'''Data Retention''': This value controls how much time report data is kept on disk. Please note that increasing the number increases the amount of disk space that is needed for data storage. | |||
''Note:'' NG Firewall version 16.3 and above stops reporting data when free space falls below 5 GB. | |||
* '' | * ''Delete All Reports Data'': If you are running low on disk space and you wish to free space by wiping the reports database you can use this option. | ||
'''Google Drive Backup''': If your system is connected to your Google account, you can configure Reports backups to Google Drive. | |||
* '' | * ''Upload Data to Google Drive'' If enabled, and the Google Connector in [[Directory Connector]] is enabled, your daily data will be uploaded to google drive each night for safe storage. | ||
* ''Upload CSVs to Google Drive'' If enabled, and the Google Connector in [[Directory Connector]] is enabled, your daily CSV files will be uploaded to google drive each night for safe storage. | |||
* ''Google Drive Directory'' configures which subdirectory data will be uploaded to in google drive. | |||
'''Import/Restore Data Backup Files''' imports data from a previous backup into the database. ''NOTE:'' this directly imports the SQL contents. If you have upgraded and the database schema has significantly changed since the time of the back, the import will not work correctly. | |||
{{ServiceAppScreenshot|reports|data}} | |||
=== Email === | === Email Templates === | ||
You can customize emailed reports using Report Templates. You can create as many as you wish with any combination of: | You can customize emailed reports using Report Templates. You can create as many as you wish with any combination of: | ||
:* '''Interval''': Daily, Weekly, Monthly. | :* '''Interval''': Daily, Weekly, Monthly, Week to Date, Month to Date. The determines the time interval that the report will cover. Beware that enough data is available via the Retention settings to provide the data for the configured interval. | ||
:* '''Mobile''': Generate chart images more appropriate for a mobile device. | :* '''Mobile''': Generate chart images more appropriate for a mobile device. | ||
:* '''Reports''': Select those reports under Config and Application sections. Text and chart reports are allowed but not event list reports. Reports for applications will be included only if that application is installed. | :* '''Reports''': Select those reports under Config and Application sections. Text and chart reports are allowed but not event list reports. Reports for applications will be included only if that application is installed. | ||
| Line 108: | Line 270: | ||
Email Templates must be associated with Report Users. | Email Templates must be associated with Report Users. | ||
{{ServiceAppScreenshot|reports|email-templates}} | |||
=== Reports Users === | |||
Reports users are users that are not administrators, but can still view reports. | |||
:* ''' | :* '''Email Address''' is the email address (and username) of the report user. ''admin'' is a special case that determines if administrators will receive emails and alerts. | ||
:* '''Email Alerts''' determines if this reports user will receive email alerts. | |||
:* '''Email Reports''' determines if this reports user will received email report summaries. | |||
:* '''Email Templates''' determines which email report summaries this user will receive if ''Email Reports'' is enabled. | |||
:* '''Online Access''' if enabled, a URL to online reports is included in emailed report summaries for this user. | |||
:* '''Change Password''' changes the password for this reports user. | |||
{{ServiceAppScreenshot|reports|reports-users}} | |||
=== Name Map === | === Name Map === | ||
You can use the Name Map to manually configure the hostname for hosts. | You can use the Name Map to manually configure the hostname for hosts. NG Firewall often can automatically determine the hostname for the IP automatically via DHCP or other methods. You can view the current names for currently active hosts in the [[Hosts]] | ||
However, when | However, when NG Firewall is unable to automatically determine a hostname for an IP the Name Map provides a way to manually name them. | ||
{{ServiceAppScreenshot|reports|name-map}} | |||
== Accessing Reports == | |||
If a user is set up to receive email | If a user is set up to receive email report summaries, they only need to view or download the HTML attachment to see an overview report. If they need more information or would like to drill down to specific users or machines, they can use the link in the email, which will open Reports on the NG Firewall if it is accessible from their location. | ||
To access Reports directly from a browser, you have two options: | To access Reports directly from a browser, you have two options: | ||
* '''Outside the | * '''Outside the NG Firewall network''': Browse to the IP of the NG Firewall /reports using HTTPs, such as <tt>https://1.2.3.4/reports</tt>. | ||
* '''Inside the | * '''Inside the NG Firewall network''': Browse to the IP of the NG Firewall /reports, such as <tt>https://192.168.1.1/reports</tt>. | ||
Please note that to view Reports from outside the network you'll need to check '''Allow HTTPS on WANs''' at '''Config > Network > Advanced > Filter Rules'''. If you have changed the '''External HTTPS Port''', you'll need to use the proper HTTPS port when connecting from the outside. | Please note that to view Reports from outside the network you'll need to check '''Allow HTTPS on WANs''' at '''Config > Network > Advanced > Filter Rules'''. If you have changed the '''External HTTPS Port''', you'll need to use the proper HTTPS port when connecting from the outside. | ||
Latest revision as of 18:26, 3 May 2022
 Reports Reports
|
|
About NG Firewall Reports
Reports provides users with detailed statistics of the traffic and activity on your network.
These reports can be viewed online, either through the administration interface or through the separate reporting interface available to non-administrators reporting-only users.
Customizable report summaries can be sent via email, which includes basic information and a link to view the online reports if the user has access.
Reports can backup your data in multiple formats to Google Drive for long term storage.
Settings
This section reviews the different settings and configuration options available for Reports.
Status
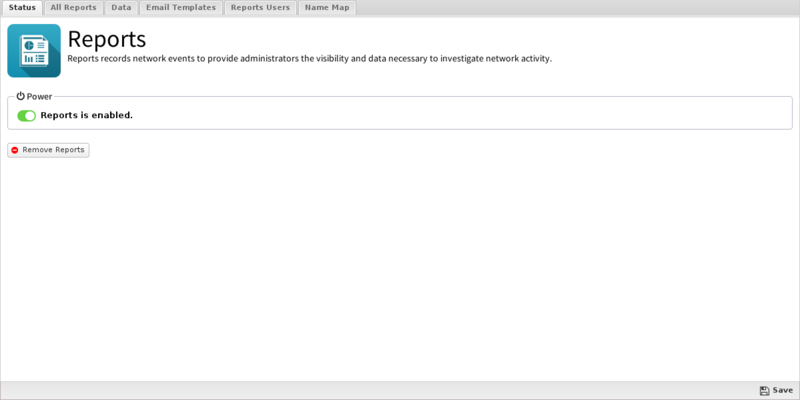
On this tab you can click View Reports to open up Reports in a new browser tab.
All Reports
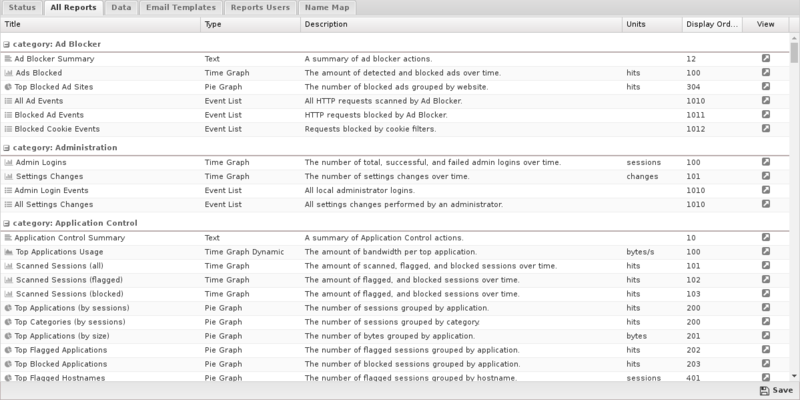
This is the full list of all currently existing reports. This includes all the default reports and any custom reports that have been added.
To edit a report, click on View and then click on Settings.
To delete a custom report, click on View and then click on Delete.
To create a new custom report, click View on an existing similar report, then click Settings then change the name and click Save as New Report.
To create a report from scratch, go to Reports and click on Create New in the lower left. When creating reports from scratch, each field must be carefully chosen and tuned until the desired data is provided. This process can be time consuming and difficult. It is suggested to work with a similar report to required the desired result. Additionally you can ask for help via support or the forums and import the report if someone can craft it for you.
If creating a report from scratch, the settings and fields and their purposes are described below.
Report Entry
A report is many settings that essentially describe how to craft a SQL query and how to display the data. Here are the fields:
| Name | Value | Available | Description |
|---|---|---|---|
| Report Type | Text, Pie Graph, Time Graph, Time Graph Dynamic, Event List | The type of graph | |
| Title | Text | All | The report title |
| Category | Any existing category/application | All | The category in which the report is located |
| Description | Text | All | A brief description of the report |
| Text String | Text | Text | The text used to create the Text Report Type |
| Pie Group Column | Text | Pie Graph | The column to "group by" in top X charts (usually user, host, and so on) |
| Pie Sum Column | Text | Pie Graph | The column to sum in the top X charts (usually count, bytes, and so on) |
| Order By Column | Text | Pie Graph | The column to order by |
| Graph Style | Pie, Pie 3D, Donut, Donut 3D, Column, Column 3D | Pie Graph | The render style of the pie graph |
| Pie Slices Number | Integer | Pie Graph | The number of slices to display |
| Units | Text | Pie Graph | The units being displayed (usually bytes, sessions, and so on) |
| Graph Style | Line, Area, Stacked Area, Column, Overlapped Column, Stacked Columns | Time Graph | The render style of the time graph |
| Time Data Interval | Auto, Second, Minute, Hour, Day, Week, Month | Time Graph | The time aggregation unit or resolution |
| Approximation | Average, High, Low, Sum | Time Graph | The method used to aggregate/combine data points |
| Units | Text | Time Graph | The units being displayed (usually bytes, sessions, and so on) |
| Series Renderer | None, Interface, Protocol | Time Graph | The renderer used to display human-readable names |
| Dynamic Column | Text | Time Graph Dynamic | The column to select for/group by |
| Dynamic Value | Text | Time Graph Dynamic | The value to sort by and display |
| Dynamic Limit | Integer | Time Graph Dynamic | The number of series to show |
| Aggregation Function | Count, Sum, Min, Max | Time Graph Dynamic | The function used to aggregate by dynamic values grouped by dynamic column |
| Graph Style | Line, Area, Stacked Area, Column, Overlapped Column, Stacked Columns | Time Graph Dynamic | The render style of the time graph |
| Approximation | Average, High, Low, Sum | Time Graph Dynamic | The method used to aggregate/combine data points |
| Units | Text | Time Graph Dynamic | The units being displayed (usually bytes, sessions, and so on) |
| Series Renderer | None, Interface, Protocol | Time Graph Dynamic | The renderer used to display human-readable names |
| Colors | Color Picker | All | The color palette to use |
| Display Order | Integer | All | The integer used to determine the report's position in the category list |
Data
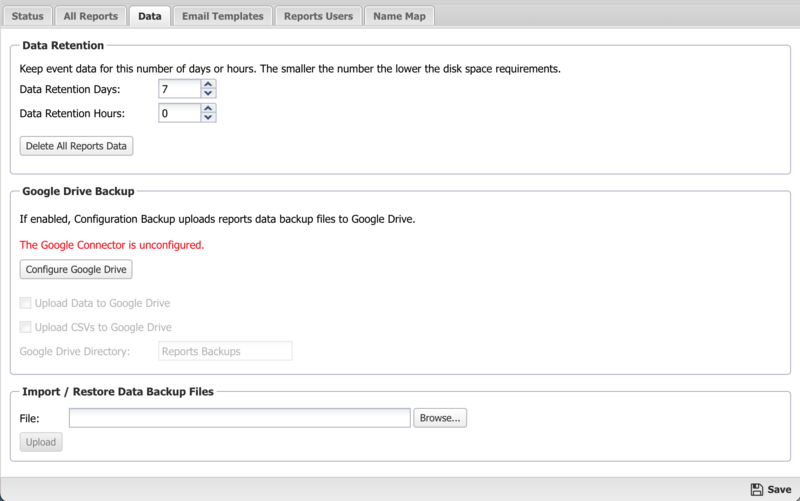
Data Retention: This value controls how much time report data is kept on disk. Please note that increasing the number increases the amount of disk space that is needed for data storage.
Note: NG Firewall version 16.3 and above stops reporting data when free space falls below 5 GB.
- Delete All Reports Data: If you are running low on disk space and you wish to free space by wiping the reports database you can use this option.
Google Drive Backup: If your system is connected to your Google account, you can configure Reports backups to Google Drive.
- Upload Data to Google Drive If enabled, and the Google Connector in Directory Connector is enabled, your daily data will be uploaded to google drive each night for safe storage.
- Upload CSVs to Google Drive If enabled, and the Google Connector in Directory Connector is enabled, your daily CSV files will be uploaded to google drive each night for safe storage.
- Google Drive Directory configures which subdirectory data will be uploaded to in google drive.
Import/Restore Data Backup Files imports data from a previous backup into the database. NOTE: this directly imports the SQL contents. If you have upgraded and the database schema has significantly changed since the time of the back, the import will not work correctly.
Email Templates
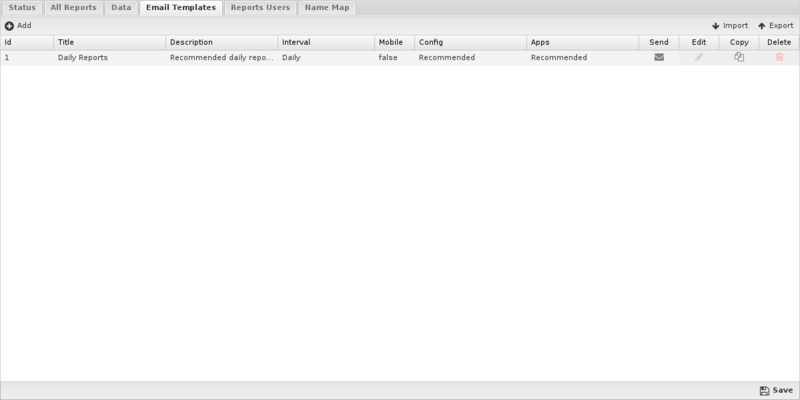
You can customize emailed reports using Report Templates. You can create as many as you wish with any combination of:
- Interval: Daily, Weekly, Monthly, Week to Date, Month to Date. The determines the time interval that the report will cover. Beware that enough data is available via the Retention settings to provide the data for the configured interval.
- Mobile: Generate chart images more appropriate for a mobile device.
- Reports: Select those reports under Config and Application sections. Text and chart reports are allowed but not event list reports. Reports for applications will be included only if that application is installed.
Additionally, you can copy the settings for an existing report.
The default Daily Reports template includes common text and chart reports for your system. This template is fixed and cannot be changed or modified.
Email Templates must be associated with Report Users.
Reports Users
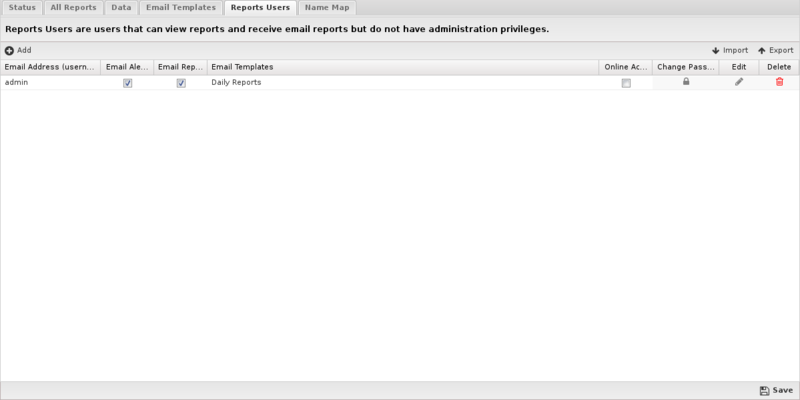
Reports users are users that are not administrators, but can still view reports.
- Email Address is the email address (and username) of the report user. admin is a special case that determines if administrators will receive emails and alerts.
- Email Alerts determines if this reports user will receive email alerts.
- Email Reports determines if this reports user will received email report summaries.
- Email Templates determines which email report summaries this user will receive if Email Reports is enabled.
- Online Access if enabled, a URL to online reports is included in emailed report summaries for this user.
- Change Password changes the password for this reports user.
Name Map
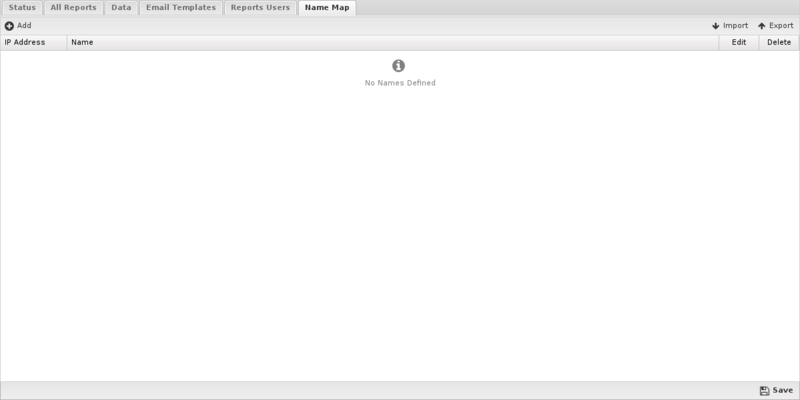
You can use the Name Map to manually configure the hostname for hosts. NG Firewall often can automatically determine the hostname for the IP automatically via DHCP or other methods. You can view the current names for currently active hosts in the Hosts
However, when NG Firewall is unable to automatically determine a hostname for an IP the Name Map provides a way to manually name them.
Accessing Reports
If a user is set up to receive email report summaries, they only need to view or download the HTML attachment to see an overview report. If they need more information or would like to drill down to specific users or machines, they can use the link in the email, which will open Reports on the NG Firewall if it is accessible from their location.
To access Reports directly from a browser, you have two options:
- Outside the NG Firewall network: Browse to the IP of the NG Firewall /reports using HTTPs, such as https://1.2.3.4/reports.
- Inside the NG Firewall network: Browse to the IP of the NG Firewall /reports, such as https://192.168.1.1/reports.
Please note that to view Reports from outside the network you'll need to check Allow HTTPS on WANs at Config > Network > Advanced > Filter Rules. If you have changed the External HTTPS Port, you'll need to use the proper HTTPS port when connecting from the outside.
Report Viewer
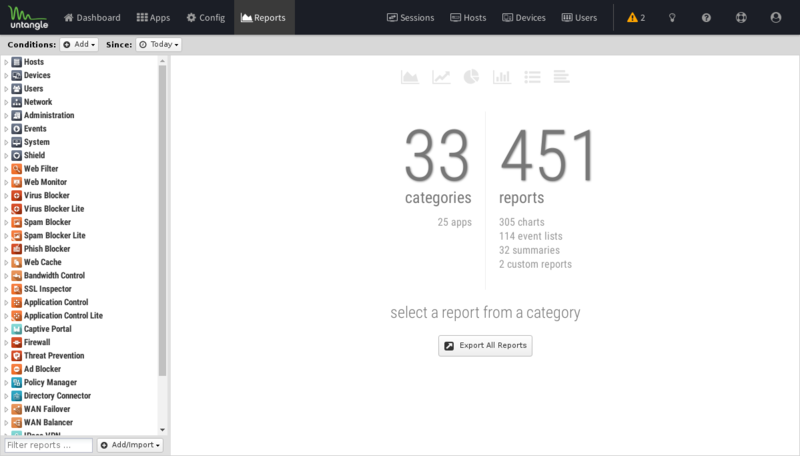
Reports provide a graphical view of the network traffic and actions of your NG Firewall. Various reports are available within applications and base system components. The reports can be manipulated to drill down, customize, and export data in many ways using the Report Viewer.
There are a few panels in the Report Viewer:
- The top panel: This top panel (just below the navigation menu) allow you specify which data is viewed. By default, there is just a timeframe and no conditions, so reports will show all data for the specified timeframe. Conditions can be viewed to view more specific data, such as a specific host, user, domain, application, web category, etc.
- The left panel: This allows you to choose the report you wish to view. At the bottom you can use the search box to quickly find reports with the specified string in the title. You can also import and create new reports using the "Add/Import" button.
- The chart panel: This panel shows you the specified report. It also includes several action buttons at the top.
- The data panel: The data panel, hidden by default, can be displayed by clicking on the "Data View" button in the chart panel. This will show the raw data used to generate the chart and allow the user to export the data by clicking the "Export Data" button at the bottom.
Conditions
The Conditions panel appears at the top panel and can be used to filter data displayed in reports. For example, to view a "specific" host's report, you can add a condition for Client = "192.168.1.100" and then all reports available will only show data where the client is 192.168.1.100. Multiple conditions can be added to drill down and inspect data. Conditions can also be added quickly by clicking on slices in pie charts.
The Add Condition dropdown contains many commonly used conditions, or the full list of all tables and columns can be browsed by clicking on the "More" button to add conditions for any database column.
Note: Conditions will not apply to all reports. For example, If viewing a specific users report by adding a condition where Username = foobar - many reports will be greyed out and unviewable. This is because the data used to generate those reports is not relevent to the specific user (it does not contain a username column). For example, the CPU usage report is a system report that is not relevant to a specific network user and so there is no way to filter that data by user.
Condition Operators
The second field in the condition is the logical operator that will be used in evaluating the condition value defined in the last field. In most use cases the default "=" operator is what you want to use. However, there are several other operators available that make the reports and alerts a whole lot more powerful.
Conditions Example - Policy by Policy ID
In many cases, you may just want to see the traffic related to a specific policy within Policy Manager. This can be accomplished very easily by adding a condition using the Quick Add feature.
- In the Conditions panel, select Add.
- Choose Policy ID and specify equals and the policy ID in question.
- The conditions is applied and will remain applied as you switch between reports.
Conditions Example - Web Filter Categories
From pie charts, you can quickly add a condition from the Current Data window. This can be handy for use with the Web Filter category selection which we'll use for this example. Once the condition is applied, we can then use other reports to drill down to find out more information about the traffic such as which user might be responsible.
- Open Report Viewer or the Web Filter Reports tab.
- Select the Top Categories report (by size or requests). In our example, you can see Games was at the top.
- Click on the Games pie slice, and when prompted to add a condition click Yes.
- All Reports can now be viewed for Games only traffic.
- For example, the Top Clients (by request) will show the clients that visited the most gaming sites.
- For exmaple, the Web Usage (scanned) will show "Gaming" web usage throughout the day of the network.
Related Topics
Reports FAQs
What is the difference between Reports and Events?
Events and Reports are now the same. They provide real-time data for each individual application. The Events view will show the individual events that make up the reports, while reports will show a graphical interpretation of summarized events.
Why is Reports taking up all of my server's resources?
Check your Data Retention setting - if it's too high it will cause a lot of issues. Try setting it to the default of 7 to see if that helps.
Why am I not receiving an email with my Reports? 💡
If NG Firewall is set to email you and you're not receiving the emails, try the Email Test at Config > Email - if you get the test mail successfully, you should also get the email from Reports. If not, you can check /var/log/exim4/mainlog and look for the error, or contact Support.
I just upgraded my NG Firewall and my reports are missing. Why? 💡
An update may have changed how Reports stores data - the next time scheduled reports are run the report index will be rebuilt, which will allow you to access the older data. Please allow one complete reporting cycle (Daily, Weekly or Monthly) if you only run that type of report.
What is the "others" column when looking at the charts in Reports?
When looking at the Top 10 of a Reports chart, others is made up of everything else not listed. You can see the Top 9 sites visited by users in a day, while others is there to give us a baseline, for example if we saw one or two users with a larger percentage than others, we'd probably want to do some investigating as to why that user is pushing more web traffic than a large portion of the organization (relative to total organization size).
The spam and phishing stats don't seem to add up. Why?
You may notice that Reports contains a certain number of phish or spam email, however the Event Logs/CSVs show a different number. This is because the graphs show the actual number of emails while the Event Logs/CSVs treat each recipient as an individual email so per-user/host reports are correct. An example is a single spam email sent to two users - it will only be counted as one (email) in the Reports, but two (delivered emails) in the Event Logs/CSVs.
Why is the timestamp column not displayed properly in Excel when I open the CSV?
To solve this please change the format of the first column to the Date format.
Can reports users change their password?
Reports users cannot change their own password. They must contact the administrator to update the password on their behalf.
