Dashboard: Difference between revisions
No edit summary |
No edit summary |
||
| (9 intermediate revisions by 2 users not shown) | |||
| Line 3: | Line 3: | ||
<span style="display:none" class="helpSource dashboard_manager_dashboard_widgets">Dashboard</span> | <span style="display:none" class="helpSource dashboard_manager_dashboard_widgets">Dashboard</span> | ||
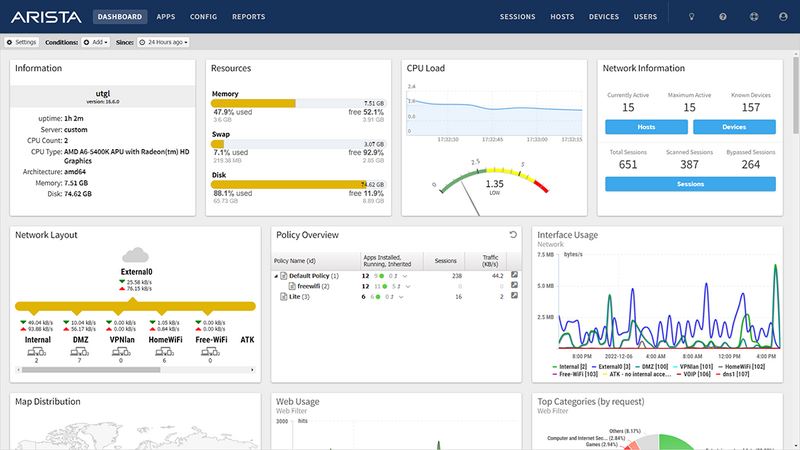
The ''Dashboard'' provides an overview of the state of your NG Firewall. It is extremely useful for quickly viewing or monitoring what is happening on the network and the current status of the NG Firewall server. | |||
{{BigScreenshot|dashboard}} | |||
By default the dashboard will show several ''widgets'' with varying pieces of information. However, the dashboard is completely customizable. Widgets can be removed and added so the administrator sees exactly the information that is important to them on the dashboard. | |||
By default the dashboard will several ''widgets'' | |||
There are many different type of ''widgets'' available: | There are many different type of ''widgets'' available: | ||
| Line 18: | Line 16: | ||
|- | |- | ||
| Information | | Information | ||
| Shows some information about | | Shows some information about NG Firewall, like name, model, version, etc. | ||
|- | |- | ||
| | | Resources | ||
| Shows | | Shows an overview current memory swap and disk usage. | ||
|- | |- | ||
| CPU Load | | CPU Load | ||
| Shows a graph of recent CPU load. | | Shows a graph of recent CPU load. | ||
|- | |- | ||
| | | Network Information | ||
| Shows | | Shows an overview of the network information like session count and device/host count. | ||
|- | |- | ||
| | | Network Layout | ||
| Shows | | Shows an overview of the network layout based on the interface configuration. | ||
|- | |- | ||
| | | Map Distribution | ||
| Shows | | Shows the current sessions mapped geolocation on a world map, sized by throughput. | ||
|- | |- | ||
| Report | | Report | ||
| Shows any Report Entry from [[Reports]] | | Shows any Report Entry from [[Reports]] | ||
|} | |} | ||
To change what is displayed on the dashboard click on ''Manage Widgets'' at the top. From here you can show or hide the built-in widgets, or add new widgets from Reports by clicking on the ''Add'' button. | |||
When adding a Report widget, you must also specify a timeframe (the number of hours worth of data to display) and a refresh interval (how often the widget refreshes on the dashboard). | |||
When viewing a Report Entry in Reports you can also easily add it to your dashboard by clicking on the ''Add to Dashboard'' button. | |||
If you see an alert icon near the top of the dashboard, hover over it for more information - these are [[Administrative Alerts]] designed to help you keep your NG Firewall healthy. | |||
Latest revision as of 15:13, 3 May 2022
The Dashboard provides an overview of the state of your NG Firewall. It is extremely useful for quickly viewing or monitoring what is happening on the network and the current status of the NG Firewall server.

By default the dashboard will show several widgets with varying pieces of information. However, the dashboard is completely customizable. Widgets can be removed and added so the administrator sees exactly the information that is important to them on the dashboard.
There are many different type of widgets available:
| Name | Information |
|---|---|
| Information | Shows some information about NG Firewall, like name, model, version, etc. |
| Resources | Shows an overview current memory swap and disk usage. |
| CPU Load | Shows a graph of recent CPU load. |
| Network Information | Shows an overview of the network information like session count and device/host count. |
| Network Layout | Shows an overview of the network layout based on the interface configuration. |
| Map Distribution | Shows the current sessions mapped geolocation on a world map, sized by throughput. |
| Report | Shows any Report Entry from Reports |
To change what is displayed on the dashboard click on Manage Widgets at the top. From here you can show or hide the built-in widgets, or add new widgets from Reports by clicking on the Add button.
When adding a Report widget, you must also specify a timeframe (the number of hours worth of data to display) and a refresh interval (how often the widget refreshes on the dashboard).
When viewing a Report Entry in Reports you can also easily add it to your dashboard by clicking on the Add to Dashboard button.
If you see an alert icon near the top of the dashboard, hover over it for more information - these are Administrative Alerts designed to help you keep your NG Firewall healthy.
